Guest Blogged by Winter Patriot
Thus writes Michael Collins in his most recent article, a masterful presentation of the study and its results.
The graphic you see at the top right corner of this post shows how overwhelmingly Americans insist on seeing how their votes are counted; click on it to see a full-sized version. Respondents were asked to choose one of the following:
A: Citizens have the right to view and obtain information about how election officials count votes.B: Citizens do not have the right to view and obtain information about how elections officials count votes.
The blue area represents respondents who chose option "A", the red represents those who chose "B", and the grey area represents those who were not sure. As you can easily see, the blue position was extremely popular for the survey overall. Below we have extensive charts and numerous graphs which show beyond any reasonable doubt that the blue position was extremely popular for every segment of the survey group!
But first things first; here's Michael Collins:
New Zogby Poll On Electronic Voting Attitudes
by Michael Collins | “Scoop” Independent Media | August 21, 2006
New Zogby Poll: It’s Nearly Unanimous
Voters Insist On Right To Observe Vote Counting
Plus Other Findings From This Unique Poll
Part I of a II part series | Washington, DC
A recent Zogby poll documents ground breaking information on the attitudes of American voters toward electronic voting. They are quite clear in the belief that the outcome of an entire election can be changed due to flaws in computerized voting machines. At a stunning rate of 92%, Americans insist on the right to watch their votes being counted. And, at an overwhelming 80%, they strongly object to the use of secret computer software to tabulate votes without citizen access to that software.
The American public is clear in its desire for free, fair, and transparent elections. An 80%-90% consensus on the right to view vote counting and opposition to secrecy by voting machine vendor is both rare and remarkable in American politics. If only the public knew that these options are virtually non existent in today’s election system.
Viewing vote counting will soon become a process of watching computers, somewhat akin to watching the radio, but without sound. Secret vote counting with computer software that citizens cannot review is now a fait accompli. Most contracts between boards of elections and voting equipment manufacturers bar both elections officials and members of the public from any access to the most important computer software; the source code that directs all the functions of the voting machines, including vote counting.
As a result of the 2002 Help America Vote Act (HAVA), a majority of these voters will be using touch screen voting machines with a lesser amount using special paper ballots counted by optical scanning devices. There are very few localities using paper ballots for the November 2006 election. If the federal government gets its way, they will be a thing of the past.
The supreme irony is that HAVA was sold to Congress as the solution to the problems of the Florida 2000 election. Of course, we now know that as many as 50,000 black Floridians were wrongly removed from the voting rolls through a highly suspect “felon purge” that missed felons but captured legitimate registered voters. And we know further that over 100,000 ballots in mostly black precincts were disqualified due to the old voter suppression standby, “spoiled ballots. ” Neither of those voting rights and civil rights problems is addressed by HAVA. It’s all about “the machines.”
A Zogby Poll was commissioned and sponsored by election rights and business law attorney Paul Lehto of Everett. Washington. This author, Michael Collins, Editor, www.electionfraudnews.com was a contributing sponsor. It consisted of 1018 interviews over a five day period beginning August 11, 2006. For further details, please see the “Appendix” at the end of this article.
This article focuses on three key questions from the survey. The responses reveal public attitudes as they were measured very recently. The outcome should give policy makers and bureaucrats serious pause for reflection upon just exactly what they have done to America’s system of elections and just how far from public beliefs they have strayed.
**********
Voters Aware of Risks of Electronic Voting – Changing an Entire Election
How aware are you that there have been reports of flaws in electronic voting or computerized voting machines that make it possible to tamper with one machine in such a way as to change the results of an entire election?
Very aware 28.5%
Somewhat aware 31.8
Aware 60.3%
Somewhat unaware 14.9
Very unaware 22.8
Unaware 37.7
Not sure 1.9
The response shows a wide spread awareness of the potential for flawed voting machines to overturn an entire election. This is highly significant since the change in election outcome represents a violation of the expressed will of the people. Elections using touch screens computers or optical scan tabulators would seem to present entry level doubt concerning any election, particularly the type of nail biters that are common in America over the past few years.
All subgroups were near or exceeded 50% or greater in awareness ( very, somewhat) of the risks of electronic voting.
The breakdown politically is instructive. Combining the “ very” and somewhat aware responses shows a near parity by political identification: Democrats 59.9%; Republicans 58.3%; and Independents, the highest at 63.8% awareness. Dividing the sample by political ideology shows Libertarians with the highest level of awareness concerning the risks of computerized voting, 81%, and Moderates with the lowest at 55.9%. Of interest, Liberals and those describing themselves as Very Conservative were nearly identical in their awareness at 62.7% and 61% respectively.
**********
Near Universal Demand to See the Votes Counted
In some states, members of the public have the right to view the counting of votes and verify how that process is working. In other states, citizens are in effect barred from viewing vote counting even if they would like to view the process. Which of the following two statements are you more likely to agree with – A or B?
Statement A: Citizens have the right to view and obtain information about how election officials count votes. 91.8%Statement B: Citizens do not have the right to view and obtain information about how elections officials count votes. 5.9
Neither/Not sure 2.3
Most all likely voters (92%) agree that citizens have the right to view and obtain information about how election officials’ count votes (Statement A). Just 6% feel citizens do not have this right (Statement B).
Four fifths of respondents within every demographic group selected the right for citizen review and access, Statement A. This includes overwhelming majorities of both Kerry (92.8%) and Bush supporters (90.8%); independents (96.9%); Catholics (92.8%), Protestants (90.8%), Jews (87.2%), and those with no religious affiliation (93.3%); and two points above the average, NASCAR fans, 93.9%.
If and when citizens begin demanding this widely assumed option, they will be gravely disappointed. Viewing vote counting in the era of electronic voting means something different than it did in the days of paper ballots. In the case of touch screen devices, the vote count consists of poll workers or technicians taking data tapes out of a computerized touch screen device. With optical scan ballots and voting machines, tabulation (vote counting) involves pressing a button for a total count after the special paper ballots have been scanned through the computerized scanning device.
The process of removing public review of voting and vote counting began in earnest with the 2002 Help America Vote Act. In a previous article with Paul Lehto, the clear intent to herd local and state governments into the seemingly happy pasture of touch screen voting devices is described in depth. In essence, the three step process of forcing locals to accept touch screen devices, stripping voters and government agencies of their rights to review and understand voting, and locking that system in place for the indefinite future is nearly complete.
The 2006 election represents the brave new world of electronic voting. The American people want something entirely different: free, fair, and transparent elections with full citizen participation and review. The following questions and responses provide convincing evidence to support that claim.
**********
Voters Opposed to Secret Software to Count Votes
With computerized electronic voting machines, votes are counted using proprietary or confidential software from corporate vendors that is not disclosed to citizens. Do you agree or disagree that it is acceptable for votes to be counted in secret without any outside observers from the public?
Agree 13.7%
Disagree 79.8
Not sure 6.5
There is overwhelming objection to vendor specific secret software used to count votes outside the purview of public observation. This is a sentiment shared by no less than 70% of the people in any sub-group in the survey. This includes every political party; political ideology; race, religion; age group; educational level; and income group. This included 85.5% of rural residents and 79.8% of NASCAR fans.
Once again, the public is in for a profound disappointment. Nearly every state and county board of elections has a contract with the voting machine vendors that prohibit access to and review of voting machine “source code,” the software that controls all of the key functions of vote counting. These contracts are freely entered into by government officials and in place for a period of months or years. Even with full access to source code, the level of expertise and manpower necessary to police malicious acts, which we know can occur, makes such disclosure a Pyrrhic victory; a distraction from the return to real ballots, counted by real people, open to full supervision and inquiry.
**********
The Public's Right to Know and Their Right to Know What They Don’t Know
The Zogby Poll makes it clear that the public insists on the right to view vote counting. At 92% agreement with Statement A above, the public clearly thinks that it should have this option. There is also strong agreement that computerized voting should be transparent; that secret software, meaning secret vote counting is totally unacceptable.
What will people think and do when they find out that these rights are (a) not granted universally either in law or by custom and (b) that even if they are granted, they are virtually unobtainable due to the nature of computerized voting? Invisible ballots cannot be observed by voters. Computer software calculations cannot be observed by voters. Inquiring about and receiving information on these invisible processes requires an act of faith of epic proportions. Voters are expected to believe summary data and tables from election officials who routinely deny and/or discourage access to vote counting and who sign contracts with private vendors like Diebold, Sequoia, and ES&S, that surrender the right of officials or the public to inspect the most important software in the voting machines, the source code.
There has been a virtual media blackout on in depth coverage of these issues by the national corporate media. The work of Lou Dobbs and Catherine Crier are notable and powerful exceptions. Lou Dobbs’ coverage includes online polls that consistently show 80% and greater preference for a complete dismissal of voting machines and a return to paper ballots.
The public has the right to observe the entire election process. It’s called transparency. The public has a right to get information on how that process works in order to satisfy the requirement for free and fair elections. These rights are unavailable and the public does not even know it. If and when these issues are covered by the broader media with insight and attention, there may very well be the type of outrage at the loss of our liberties that we have seen from Lou Dobbs and Catherine Crier. That would be a most unpleasant event for those who have bargained away voting rights for the sake of a free Federal grant to buy voting machines people inherently distrust.
*** # # # # ***
Copyright. Permission to reproduce in whole or part with attribution to the author, Michael Collins, a link to “Scoop,” and attribution of polling results to Zogby International.
Michael Collins is a writer who focuses on clean elections and voting rights. He is the editor of the election fraud web site, www.ElectionFraudNews.com. He has written articles on a number of topics for “Scoop” Independent News including: The Disenfranchisement of Katrina's Survivors; The Unanswered Question: Who Really Won In 2004? ; Secret Vote Counting, a scathing critique of HAVA; and Kennedy's Challenge, a detailed response to Salon’s attack on the Robert F. Kennedy Jr. article on stolen election 2004. Special thanks to Stella Black for editorial assistance; Paul Lehto for very helpful suggestions; and acknowledgement and thanks to the Zogby professional (R) who did such an outstanding job summarizing complex data.
The following charts show what happens when the survey "slices" its panel into sub-groups based on seemingly unrelated questions, such as age, marital status, political philosophy, family income, virtually everything except shoe size. And it amazes this nearly frozen blogger to look at the column marked "A%". That's the percentage of blue for a given slice.
Most of the numbers in this column are in the 90s; the lowest is 76. This means that no matter how you slice it, the vast majority of Americans agree with one of the things The BRAD BLOG has been saying all along:
You can click on the text of a question to see a graph showing results for the slices created by that question. For instance, if you click on the word "Region", you will see the graph that represents results by region.
Column headings for this chart are:
| Total | A | B | ns | A% | B% | ns% |
|---|---|---|---|---|---|---|
| Total | 934 | 60 | 24 | 91.7% | 5.9% | 2.4% |
| Region | A | B | ns | A% | B% | ns% |
| West | 190 | 9 | 4 | 93.6% | 4.4% | 2.0% |
| Central | 290 | 15 | 10 | 92.1% | 4.8% | 3.2% |
| South | 239 | 20 | 5 | 90.5% | 7.6% | 1.9% |
| East | 214 | 16 | 4 | 91.5% | 6.8% | 1.7% |
| US direction | A | B | ns | A% | B% | ns% |
| Wrong | 560 | 34 | 9 | 92.9% | 5.6% | 1.5% |
| ns | 67 | 7 | 6 | 83.8% | 8.8% | 7.5% |
| Right | 307 | 19 | 8 | 91.9% | 5.7% | 2.4% |
| Age Group (5) | A | B | ns | A% | B% | ns% |
| 70+ | 99 | 8 | 6 | 87.6% | 7.1% | 5.3% |
| 55-69 | 185 | 10 | 4 | 93.0% | 5.0% | 2.0% |
| 35-54 | 412 | 13 | 10 | 94.7% | 3.0% | 2.3% |
| 25-34 | 161 | 8 | 2 | 94.2% | 4.7% | 1.2% |
| 18-24 | 57 | 18 | 0 | 76.0% | 24.0% | 0.0% |
| 2004 result | A | B | ns | A% | B% | ns% |
| GOP | 480 | 31 | 18 | 90.7% | 5.9% | 3.4% |
| Dem | 455 | 29 | 6 | 92.9% | 5.9% | 1.2% |
| Age group (4) | A | B | ns | A% | B% | ns% |
| 65+ | 142 | 10 | 8 | 88.8% | 6.3% | 5.0% |
| 50-64 | 224 | 11 | 4 | 93.7% | 4.6% | 1.7% |
| 30-49 | 402 | 15 | 10 | 94.1% | 3.5% | 2.3% |
| 18-29 | 147 | 22 | 0 | 87.0% | 13.0% | 0.0% |
| Education | A | B | ns | A% | B% | ns% |
| College Grad | 500 | 22 | 11 | 93.8% | 4.1% | 2.1% |
| Some College | 260 | 20 | 7 | 90.6% | 7.0% | 2.4% |
| HS Grad | 133 | 15 | 3 | 88.1% | 9.9% | 2.0% |
| didn't grad HS | 28 | 3 | 2 | 84.8% | 9.1% | 6.1% |
| Union | A | B | ns | A% | B% | ns% |
| No/ns | 737 | 53 | 22 | 90.8% | 6.5% | 2.7% |
| Yes | 196 | 7 | 2 | 95.6% | 3.4% | 1.0% |
| Party Affiliation | A | B | ns | A% | B% | ns% |
| Republican | 329 | 31 | 17 | 87.3% | 8.2% | 4.5% |
| Independent | 256 | 6 | 3 | 96.6% | 2.3% | 1.1% |
| Democratic | 348 | 23 | 5 | 92.6% | 6.1% | 1.3% |
| Religion | A | B | ns | A% | B% | ns% |
| Catholic | 254 | 16 | 4 | 92.7% | 5.8% | 1.5% |
| Protestant | 460 | 30 | 17 | 90.7% | 5.9% | 3.4% |
| Jewish | 27 | 3 | 1 | 87.1% | 9.7% | 3.2% |
| Other/None | 189 | 12 | 2 | 93.1% | 5.9% | 1.0% |
| Born Again | A | B | ns | A% | B% | ns% |
| No/ns | 194 | 15 | 7 | 89.8% | 6.9% | 3.2% |
| Yes | 264 | 15 | 10 | 91.3% | 5.2% | 3.5% |
| Armed Forces | A | B | ns | A% | B% | ns% |
| No/ns | 767 | 49 | 22 | 91.5% | 5.8% | 2.6% |
| Yes | 165 | 11 | 2 | 92.7% | 6.2% | 1.1% |
| Ideology | A | B | ns | A% | B% | ns% |
| Libertarian | 21 | 2 | 1 | 87.5% | 8.3% | 4.2% |
| Progressive | 93 | 5 | 0 | 94.9% | 5.1% | 0.0% |
| Liberal | 151 | 11 | 2 | 92.1% | 6.7% | 1.2% |
| Moderate | 267 | 12 | 5 | 94.0% | 4.2% | 1.8% |
| Conservative | 283 | 27 | 8 | 89.0% | 8.5% | 2.5% |
| Very Conservative | 74 | 3 | 6 | 89.2% | 3.6% | 7.2% |
| Race | A | B | ns | A% | B% | ns% |
| White | 703 | 51 | 18 | 91.1% | 6.6% | 2.3% |
| Hispanic | 76 | 1 | 3 | 95.0% | 1.3% | 3.8% |
| African American | 102 | 6 | 2 | 92.7% | 5.5% | 1.8% |
| Asian | 20 | 0 | 0 | 100.0% | 0.0% | 0.0% |
| Other | 20 | 0 | 0 | 100.0% | 0.0% | 0.0% |
| NASCAR fan | A | B | ns | A% | B% | ns% |
| No/ns | 711 | 52 | 18 | 91.0% | 6.7% | 2.3% |
| Yes | 223 | 8 | 6 | 94.1% | 3.4% | 2.5% |
| Gender | A | B | ns | A% | B% | ns% |
| Female | 475 | 39 | 15 | 89.8% | 7.4% | 2.8% |
| Male | 459 | 21 | 9 | 93.9% | 4.3% | 1.8% |
| Outside-Home Wage Earner | A | B | ns | A% | B% | ns% |
| No/ns | 177 | 17 | 10 | 86.8% | 8.3% | 4.9% |
| Yes | 298 | 22 | 5 | 91.7% | 6.8% | 1.5% |
| Marital Status | A | B | ns | A% | B% | ns% |
| Married | 564 | 26 | 10 | 94.0% | 4.3% | 1.7% |
| Single | 193 | 20 | 3 | 89.4% | 9.3% | 1.4% |
| D/W/S | 158 | 14 | 10 | 86.8% | 7.7% | 5.5% |
| Civil Union | 15 | 0 | 0 | 100.0% | 0.0% | 0.0% |
| Investor Class | A | B | ns | A% | B% | ns% |
| no/ns | 478 | 29 | 18 | 91.0% | 5.5% | 3.4% |
| yes | 309 | 21 | 6 | 92.0% | 6.3% | 1.8% |
| Children under 17 | A | B | ns | A% | B% | ns% |
| No/ns | 624 | 39 | 18 | 91.6% | 5.7% | 2.6% |
| Yes | 309 | 21 | 6 | 92.0% | 6.3% | 1.8% |
| Shop at Wal-Mart | A | B | ns | A% | B% | ns% |
| Weekly | 239 | 16 | 10 | 90.2% | 6.0% | 3.8% |
| Monthly | 261 | 19 | 5 | 91.6% | 6.7% | 1.8% |
| Yearly | 246 | 16 | 5 | 92.1% | 6.0% | 1.9% |
| Never | 164 | 7 | 4 | 93.7% | 4.0% | 2.3% |
| Family Income | A | B | ns | A% | B% | ns% |
| $100K+ | 166 | 5 | 2 | 96.0% | 2.9% | 1.2% |
| $75-100K | 135 | 13 | 4 | 88.8% | 8.6% | 2.6% |
| $50-75K | 185 | 3 | 0 | 98.4% | 1.6% | 0.0% |
| $35-50K | 114 | 7 | 1 | 93.4% | 5.7% | 0.8% |
| $25-35K | 101 | 3 | 5 | 92.7% | 2.8% | 4.6% |
| <$25K | 102 | 11 | 5 | 86.4% | 9.3% | 4.2% |
| Community Size | A | B | ns | A% | B% | ns% |
| Large City | 244 | 16 | 5 | 92.1% | 6.0% | 1.9% |
| Small City | 233 | 17 | 3 | 92.1% | 6.7% | 1.2% |
| Suburbs | 177 | 9 | 8 | 91.2% | 4.6% | 4.1% |
| Rural | 277 | 19 | 7 | 91.4% | 6.3% | 2.3% |
The following chart is similar to the previous one, except it omits the questions. It shows only the various slices created by those questions, sorted according to the column "A%".
Column headings for this chart are the same as above, plus:
So, for example, you can see here that respondents who identified their party affiliation as "Independent" made up 26% of the survey and chose "A" 96.6% of the time.
| answer | % | A | B | ns | A% | B% | ns% |
|---|---|---|---|---|---|---|---|
| Asian | 2.0% | 20 | 0 | 0 | 100.0% | 0.0% | 0.0% |
| Other Race | 2.0% | 20 | 0 | 0 | 100.0% | 0.0% | 0.0% |
| Civil Union | 1.5% | 15 | 0 | 0 | 100.0% | 0.0% | 0.0% |
| $50-75K | 18.5% | 185 | 3 | 0 | 98.4% | 1.6% | 0.0% |
| Party: Independent | 26.0% | 256 | 6 | 3 | 96.6% | 2.3% | 1.1% |
| $100K+ | 17.0% | 166 | 5 | 2 | 96.0% | 2.9% | 1.2% |
| Union: Yes | 20.1% | 196 | 7 | 2 | 95.6% | 3.4% | 1.0% |
| Hispanic | 7.9% | 76 | 1 | 3 | 95.0% | 1.3% | 3.8% |
| Progressive | 9.6% | 93 | 5 | 0 | 94.9% | 5.1% | 0.0% |
| Age 35-54 | 42.7% | 412 | 13 | 10 | 94.7% | 3.0% | 2.3% |
| Age 25-34 | 16.8% | 161 | 8 | 2 | 94.2% | 4.7% | 1.2% |
| Age 30-49 | 41.9% | 402 | 15 | 10 | 94.1% | 3.5% | 2.3% |
| NASCAR: Yes | 23.3% | 223 | 8 | 6 | 94.1% | 3.4% | 2.5% |
| Moderate | 27.9% | 267 | 12 | 5 | 94.0% | 4.2% | 1.8% |
| Married | 58.9% | 564 | 26 | 10 | 94.0% | 4.3% | 1.7% |
| Male | 48.0% | 459 | 21 | 9 | 93.9% | 4.3% | 1.8% |
| College Grad | 52.4% | 500 | 22 | 11 | 93.8% | 4.1% | 2.1% |
| Age 50-54 | 23.5% | 224 | 11 | 4 | 93.7% | 4.6% | 1.7% |
| Wal-Mart Never | 17.2% | 164 | 7 | 4 | 93.7% | 4.0% | 2.3% |
| West Region | 19.9% | 190 | 9 | 4 | 93.6% | 4.4% | 2.0% |
| $35-50K | 12.0% | 114 | 7 | 1 | 93.4% | 5.7% | 0.8% |
| Other/No Religion | 19.9% | 189 | 12 | 2 | 93.1% | 5.9% | 1.0% |
| Age 55-69 | 19.5% | 185 | 10 | 4 | 93.0% | 5.0% | 2.0% |
| Wrong Direction | 59.2% | 560 | 34 | 9 | 92.9% | 5.6% | 1.5% |
| Blue State (Dem 2004) | 48.1% | 455 | 29 | 6 | 92.9% | 5.9% | 1.2% |
| African American | 10.8% | 102 | 6 | 2 | 92.7% | 5.5% | 1.8% |
| Catholic | 26.9% | 254 | 16 | 4 | 92.7% | 5.8% | 1.5% |
| Armed Forces: Yes | 17.5% | 165 | 11 | 2 | 92.7% | 6.2% | 1.1% |
| $25-35K | 10.7% | 101 | 3 | 5 | 92.7% | 2.8% | 4.6% |
| Party: Democratic | 36.9% | 348 | 23 | 5 | 92.6% | 6.1% | 1.3% |
| Wal-Mart Yearly | 26.2% | 246 | 16 | 5 | 92.1% | 6.0% | 1.9% |
| Small City | 24.9% | 233 | 17 | 3 | 92.1% | 6.7% | 1.2% |
| Large City | 26.0% | 244 | 16 | 5 | 92.1% | 6.0% | 1.9% |
| Liberal | 16.1% | 151 | 11 | 2 | 92.1% | 6.7% | 1.2% |
| Central Region | 30.9% | 290 | 15 | 10 | 92.1% | 4.8% | 3.2% |
| Kids under 17: Yes | 33.0% | 309 | 21 | 6 | 92.0% | 6.3% | 1.8% |
| Investor: Yes | 33.0% | 309 | 21 | 6 | 92.0% | 6.3% | 1.8% |
| Right Direction | 32.8% | 307 | 19 | 8 | 91.9% | 5.7% | 2.4% |
| Grand Total | 100.0% | 934 | 60 | 24 | 91.7% | 5.9% | 2.4% |
| Outside Wage: Yes | 31.9% | 298 | 22 | 5 | 91.7% | 6.8% | 1.5% |
| Kids under 17: No/ns | 66.9% | 624 | 39 | 18 | 91.6% | 5.7% | 2.6% |
| Wal-Mart Monthly | 28.0% | 261 | 19 | 5 | 91.6% | 6.7% | 1.8% |
| Armed Forces: No/ns | 82.3% | 767 | 49 | 22 | 91.5% | 5.8% | 2.6% |
| East Region | 23.0% | 214 | 16 | 4 | 91.5% | 6.8% | 1.7% |
| Rural | 29.8% | 277 | 19 | 7 | 91.4% | 6.3% | 2.3% |
| Born Again: Yes | 28.4% | 264 | 15 | 10 | 91.3% | 5.2% | 3.5% |
| Suburbs | 19.1% | 177 | 9 | 8 | 91.2% | 4.6% | 4.1% |
| White | 75.8% | 703 | 51 | 18 | 91.1% | 6.6% | 2.3% |
| Investor: No/ns | 51.6% | 478 | 29 | 18 | 91.0% | 5.5% | 3.4% |
| NASCAR: No/ns | 76.7% | 711 | 52 | 18 | 91.0% | 6.7% | 2.3% |
| Union: No/ns | 79.8% | 737 | 53 | 22 | 90.8% | 6.5% | 2.7% |
| Red State (GOP 2004) | 52.0% | 480 | 31 | 18 | 90.7% | 5.9% | 3.4% |
| Protestant | 49.8% | 460 | 30 | 17 | 90.7% | 5.9% | 3.4% |
| Some College | 28.2% | 260 | 20 | 7 | 90.6% | 7.0% | 2.4% |
| South Region | 25.9% | 239 | 20 | 5 | 90.5% | 7.6% | 1.9% |
| Wal-Mart Weekly | 26.0% | 239 | 16 | 10 | 90.2% | 6.0% | 3.8% |
| Born Again: No/ns | 21.2% | 194 | 15 | 7 | 89.8% | 6.9% | 3.2% |
| Female | 52.0% | 475 | 39 | 15 | 89.8% | 7.4% | 2.8% |
| Single | 21.2% | 193 | 20 | 3 | 89.4% | 9.3% | 1.4% |
| Very Conservative | 8.2% | 74 | 3 | 6 | 89.2% | 3.6% | 7.2% |
| Conservative | 31.2% | 283 | 27 | 8 | 89.0% | 8.5% | 2.5% |
| $75-100K | 14.9% | 135 | 13 | 4 | 88.8% | 8.6% | 2.6% |
| Age 65+ | 15.7% | 142 | 10 | 8 | 88.8% | 6.3% | 5.0% |
| HS Grad | 14.8% | 133 | 15 | 3 | 88.1% | 9.9% | 2.0% |
| Age 70+ | 11.1% | 99 | 8 | 6 | 87.6% | 7.1% | 5.3% |
| Libertarian | 2.4% | 21 | 2 | 1 | 87.5% | 8.3% | 4.2% |
| Party: Republican | 37.0% | 329 | 31 | 17 | 87.3% | 8.2% | 4.5% |
| Jewish | 3.0% | 27 | 3 | 1 | 87.1% | 9.7% | 3.2% |
| Age 18-29 | 16.6% | 147 | 22 | 0 | 87.0% | 13.0% | 0.0% |
| D/W/S | 17.9% | 158 | 14 | 10 | 86.8% | 7.7% | 5.5% |
| Outside Wage: No/ns | 20.0% | 177 | 17 | 10 | 86.8% | 8.3% | 4.9% |
| <$25K | 11.6% | 102 | 11 | 5 | 86.4% | 9.3% | 4.2% |
| didn't grad HS | 3.2% | 28 | 3 | 2 | 84.8% | 9.1% | 6.1% |
| ns Direction | 7.9% | 67 | 7 | 6 | 83.8% | 8.8% | 7.5% |
| Age 18-24 | 7.4% | 57 | 18 | 0 | 76.0% | 24.0% | 0.0% |
Confused by all the numbers? Ask questions in the "comments" thread ... and I will do my best to answer them.
Many thanks to Michael Collins, Paul Lehto, Zogby International, Emily and Coleen.
91.7% overall! It's an even bigger "landslide" than what's-his-name got!!
UPDATE: Zogby has released more data in a PDF format. Just click here. There's a press release for Zogby too, and it's here.


 President of United States Calls for Killing Democratic Officials: 'BradCast' 11/20/25
 'Green News Report' 11/20/25
 Is MAGA Finally Beginning to Fall Apart?: 'BradCast' 11/19/25
 Trump's Terrible, Horrible,
 'Green News Report' 11/18/25
 A Kaleidoscope of Trump Corruption: 'BradCast' 11/17/25
  Sunday 'Back to Business' Toons
 Trump DOJ Takes Stand
 'Green News Report' 11/13/25
 Mamdani's 'Surprisingly Affordable' Afford-ability Agenda for NYC: 'BradCast' 11/12
 After the Shutdown and Before the Next One: 'BradCast' 11/11/25
 'Green News Report' 11/11/25
 Victories for Democracy in Election 2025; Also: 7 Dems, 1 Indie Vote to End Shutdown in Senate: 'BradCast' 11/10/25
 Sunday 'Ass Kicking' Toons
 'We Can See Light at the End of the Tunnel' After Election 2025: 'BradCast' 11/6/25
 'Green News Report' 11/6/25
 BLUE WAVE! Dems Win Everything Everywhere All at Once: 'BradCast' 11/5/25
 Repub Thuggery As Americans Vote: 'BradCast' 11/4/25
 Last Call(s) Before Election Day 2025: 'BradCast' 11/3/25
 A Pretty Weak 'Strongman': 'BradCast' 10/30/25
 Proposal for 'Politically Viable Wealth Tax' Takes Shape in CA: 'BradCast' 10/29
 Monster Storm, Endless Wars, Gamed Elections: 'BradCast' 10/28/25
 Let's Play 'Who Wants to Be a U.S. Citizen?'!: 'BradCast' 10/27/25
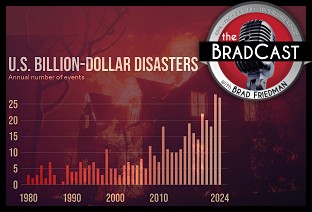 Exiled NOAA Scientists Resurrect Critical Disaster Database: 'BradCast' 10/23/25
 VA GOP VOTER REG FRAUDSTER OFF HOOK
 Criminal GOP Voter Registration Fraud Probe Expanding in VA
 DOJ PROBE SOUGHT AFTER VA ARREST
 Arrest in VA: GOP Voter Reg Scandal Widens
 ALL TOGETHER: ROVE, SPROUL, KOCHS, RNC
 LATimes: RNC's 'Fired' Sproul Working for Repubs in 'as Many as 30 States'
 'Fired' Sproul Group 'Cloned', Still Working for Republicans in At Least 10 States
 FINALLY: FOX ON GOP REG FRAUD SCANDAL
 COLORADO FOLLOWS FLORIDA WITH GOP CRIMINAL INVESTIGATION
 CRIMINAL PROBE LAUNCHED INTO GOP VOTER REGISTRATION FRAUD SCANDAL IN FL
 Brad Breaks PA Photo ID & GOP Registration Fraud Scandal News on Hartmann TV
  CAUGHT ON TAPE: COORDINATED NATIONWIDE GOP VOTER REG SCAM
 CRIMINAL ELECTION FRAUD COMPLAINT FILED AGAINST GOP 'FRAUD' FIRM
 RICK SCOTT GETS ROLLED IN GOP REGISTRATION FRAUD SCANDAL
 VIDEO: Brad Breaks GOP Reg Fraud Scandal on Hartmann TV
 RNC FIRES NATIONAL VOTER REGISTRATION FIRM FOR FRAUD
 EXCLUSIVE: Intvw w/ FL Official Who First Discovered GOP Reg Fraud
 GOP REGISTRATION FRAUD FOUND IN FL


.jpg)


