This is an analysis of the senate and house races most likely to be stolen.
THE SENATE: A MONTE CARLO ELECTION SIMULATION FORECAST
1000 simulated trial elections
Based on Polls as of Oct.14
Current Senate: 55 GOP; 44 Dem; 1 Ind
THESE ARE THE 9 CRITICAL RACES:
NJ, TN, VA, MO, CT, MT, OH, PA, RI
The Dems need to hold their lead in NJ and win 6 of the other 8 seats for a 50-49-1 majority. They have solid leads in 5 GOP seats, a narrow lead in TN,
and are slightly behind in VA. Lieberman (Ind) is far ahead in CT. Assuming they win the 5 solid GOP seats and retain NJ seat, they need to win either VA or TN for a majority.
Therefore, VA and TN should be CLOSELY MONITORED FOR FRAUD - but don't forget MO and CT.
Sensitivity Analysis
--------------------
Assuming ZERO election fraud and that the Democrats capture 60% of the undecided vote (UVA), then if the election was today there is a 99% probability that they will win a 50-49 senate majority. The win probability is slightly lower (91%) if the undecided vote is split (50% UVA).
UVA 50 55 60 67 75
N -------Win Probability-----
6... 91 96 99 100 100
7.... 9 15 22 33 50
8.... 0 0 0 0 0
UVA is the Democratic undecided voter allocation (%)
Senate Polling Detail
---------------------
(C) indicates a critical race
PROB is the probability of a Democratic win (assuming a 60% UVA)
STATE DEM;GOP DEM% GOP% PROB
Unweighted Poll Average: 49.5% 42.2% 74.3%
1 AZ Pedersen;Kyle 44 51 0.0%
2 CA Feinstein;Mountjoy 59 35 100.0%
3 CT Lamont;Liebermann 40 53 0.0% (C)
4 DE Carper;Ting 63 23 100.0%
5 FL Nelson;Harris 61 37 100.0%
6 HI Akaka; Coffee 58 30 100.0%
7 MD Cardin; Steel 53 44 100.0%
8 ME Bright;Snowe 20 68 0.0%
9 MI Stabenow; Bouchard 53 42 100.0%
10 MN Klobachar; Kennedy 53 40 100.0%
11 MT Tester;Burns 50 44 100.0% (C)
12 MO McCaskill;Talent 51 42 100.0% (C)
13 NE Nelson; Ricketts 55 32 100.0%
14 NJ Menendez; Keane 44 40 100.0% (C)
15 NM Bingaman; McCulloch 57 32 100.0%
16 NV Carter; Ensign 42 49 0.0%
17 NY Clinton; Spencer 66 31 100.0%
18 OH Brown; DeWine 54 42 100.0% (C)
19 PA Casey; Santorum 52 39 100.0% (C)
20 RI Whitehouse;Chafee 51 42 100.0% (C)
21 TN Ford; Coker 48 46 99.9% (C)
22 TX Radnofsky;Hutchison 30 54 0.0%
23 UT Asdown; Hatch 25 62 0.0%
24 VA Webb; Allen 47 49 21.7% (C)
25 VT Sanders;Torrent 64 32 100.0%
26 WA Cantwell;McGavich 54 42 100.0%
27 WI Kohl; Largo 47 34 100.0%
28 WV Byrd; Raese 63 30 100.0%
29 WY Groutage;Thomas 32 59 0.0%
___________________________________________________________
THE HOUSE: A MONTE CARLO ELECTION SIMULATION FORECAST
1000 simulated trial elections
Based on Polls as of Oct.14
Current House: 232 GOP; 202 Dem; 1 Ind
The Democrats need to capture 16 GOP seats (net) to gain control of the House.
How many of the 58-contested GOP House seats can the Democrats expect to win, assuming a FRAUD-FREE election? Corollary: How many elections will the
GOP need to steal to maintain control?
In the MOST LIKELY SCENARIO that the Democrats will win 60% of the undecided vote, they can expect to capture 32 of the 58 GOP-held seats.
There is a 99% probability that they will win 30 or more seats. Therefore, in order to retain the House, the GOP will HAVE TO STEAL A MINIMUM of 16 elections.
Of the 58 polls,
1) Democrats lead in 15 races beyond the MoE
2) Democrats lead in 11 within the MoE
3) Dems TIE the GOP in 5
4) GOP leads in 15 within the MoE
5) GOP leads in 12 beyond the MoE
THE CLOSEST RACES WITHIN THE MOE ARE THE ONES MOST LIKELY FOR FRAUD.
They are in the 22 districts between PA-6 and NY-29 displayed in this chart:
http://www.geocities.com...s1015_12021_image001.png
The analysis ASSUMES ZERO FRAUD and is based strictly on the latest poll shares, undecided voter allocation and margin of error. The model will be updated for new polling data and run again just prior to election day.
The simulation calculates the probability of the Democrats winning a specified number of the 58 seats, over a range of undecided voter allocation assumptions. It provides a VERY ROBUST ESTIMATE of the MINIMUM number of elections that would need to be stolen in order for the GOP to retain control of the House.
In a published study of over 150 incumbent elections, the challenger won the undecided vote in 82% of the races, the incumbent won in 12%, and the rest were split.
Even with the VERY CONSERVATIVE ASSUMPTION that the undecided vote will be evenly split, then assuming the elections are FRAUD-FREE, there is a virtual 100% probability that the Democrats will NET AT LEAST 25 GOP SEATS, or NINE more than the minimum required for House control.
Sensitivity Analysis
--------------------
UVA: Undecided voter % allocated to Democrats
N: number of GOP seats won by Dems
UVA 50 55 60 67 75
N ------ Probability % ------
25 100 100 100 100 100
30 35 85 99 100 100
35 0 3 30 90 100
40 0 0 0 5 70
45 0 0 0 0 1
Assumimg a 60% UVA, these are the probabilities of the Democrats winning N
or more seats:
N... 25 30 31 32 33 34 35 36 37 38 39
Prob 100 99 96 86 75 51 30 13 4 1 0
This chart displays the probability curve:
http://www.geocities.com...s1015_30243_image001.png
House Polling Detail
--------------------
Adjusted: Dem & GOP polls (60% undecided to Democrat)
Prob: probability of Democratic win
Num District Pollster Poll MoE Poll Dem GOP Adjusted Prob
Code Average Sample 3.80 Date 45.4 45.9 50.6 49.4 57.8%
1 AZ 1 RT Strategies 983 LV 3.09 10/10 50 46 52.4 47.6 99.9%
2 AZ 5 SurveyUSA 509 LV 4.40 10/15 45 48 49.2 50.8 23.8%
3 AZ 8 Zogby 500 LV 4.50 10/2 45 37 55.8 44.2 100.0%
4 CA 4 RT Strategies 997 LV 3.09 10/10 44 52 46.4 53.6 0.0%
5 CA 11 Greenberg 413 LV 4.90 9/26 48 46 51.6 48.4 90.0%
6 CA 50 SurveyUSA 540 LV 4.30 9/12 40 54 43.6 56.4 0.0%
7 CO 4 Mason-Dixon 400 LV 5.00 10/7 36 46 46.8 53.2 0.6%
8 CO 5 Mason-Dixon 400 LV 5.00 10/7 37 37 52.6 47.4 97.9%
9 CO 7 RT Strategies 991 LV 3.09 10/10 47 47 50.6 49.4 77.7%
10 CT 2 Zogby 500 LV 4.50 10/2 41 44 50.0 50.0 50.0%
11 CT 4 Zogby 500 LV 4.50 10/2 46 41 53.8 46.2 100.0%
12 CT 5 RT Strategies 996 LV 3.09 10/10 46 52 47.2 52.8 0.0%
13 FL 13 RT Strategies 1024 LV 3.07 10/10 47 44 52.4 47.6 99.9%
14 FL 16 RT Strategies 1001 LV 3.09 10/1 50 43 54.2 45.8 100.0%
15 FL 22 RT Strategies 1022 LV 3.10 8/29 44 52 46.4 53.6 0.0%
16 ID 1 RT Strategies 998 LV 3.09 10/10 43 49 47.8 52.2 0.3%
17 IL 6 RT Strategies 997 LV 3.07 10/10 47 47 50.6 49.4 77.8%
18 IL 10 Mellman Group 400 LV 4.90 10/11 32 49 43.4 56.6 0.0%
19 IL 14 RT Strategies 1003 LV 3.08 10/10 42 52 45.6 54.4 0.0%
20 IL 19 RT Strategies 1023 LV 3.08 10/10 36 53 42.6 57.4 0.0%
21 IN 2 RT Strategies 989 LV 3.07 10/10 50 46 52.4 47.6 99.9%
22 IN 8 Indiana State 626 LV 3.90 10/12 55 32 62.5 37.5 100.0%
23 IN 9 SurveyUSA 512 LV 4.40 10/15 48 46 51.6 48.4 92.3%
24 IA 1 Bennett, Petts 400 RV 4.90 10/8 48 37 57.0 43.0 100.0%
25 IA 2 RT Strategies 1006 LV 3.09 10/10 48 47 51.0 49.0 89.8%
26 KY 3 RT Strategies 996 LV 3.09 10/10 48 48 50.4 49.6 69.4%
27 KY 4 RT Strategies 1000 LV 3.09 10/10 46 49 49.0 51.0 10.2%
28 MN 1 RT Strategies 1024 LV 3.08 10/10 47 48 50.0 50.0 50.0%
29 MN 2 SurveyUSA 519 LV 4.40 10/15 42 50 46.8 53.2 0.2%
30 MN 6 RT Strategies 995 LV 3.09 10/10 50 45 53.0 47.0 100.0%
31 NV 3 Mason-Dixon 400 RV 5.00 9/21 37 47 46.6 53.4 0.4%
32 NH 1 Research 2000 300 LV 6.00 9/14 31 56 38.8 61.2 0.0%
33 NH 2 Univ of NH 220 LV 6.20 9/24 36 46 46.8 53.2 2.2%
34 NJ 7 RT Strategies 1022 LV 3.10 10/10 46 48 49.6 50.4 30.6%
35 NM 1 RT Strategies 986 LV 3.09 10/10 52 44 54.4 45.6 100.0%
36 NY 3 RT Strategies 984 LV 3.09 10/10 46 48 49.6 50.4 30.6%
37 NY 19 Abacus Assoc 600 RV 4.00 9/15 44 49 48.2 51.8 3.9%
38 NY 20 Grove Insight 400 RV 4.90 10/13 41 42 51.2 48.8 83.1%
39 NY 24 RT Strategies 1029 LV 3.07 10/10 53 42 56.0 44.0 100.0%
40 NY 26 RT Strategies 1056 LV 3.07 10/10 56 40 58.4 41.6 100.0%
41 NY 29 Cooper&Secrest 503 LV 4.40 9/21 39 43 49.8 50.2 42.9%
42 NC 8 RT Strategies 1029 LV 3.08 10/10 51 44 54.0 46.0 100.0%
43 NC 11 RT Strategies 979 LV 3.09 10/10 51 43 54.6 45.4 100.0%
44 OH 1 Anzalone-Liszt 500 LV 4.40 8/01 45 45 51.0 49.0 81.4%
45 OH 2 RT Strategies 1003 LV 3.09 10/10 48 45 52.2 47.8 99.7%
46 OH 6 RT Strategies 982 LV 3.10 8/29 56 40 58.4 41.6 100.0%
47 OH 15 RT Strategies 1015 LV 3.09 10/10 53 41 56.6 43.4 100.0%
48 OH 18 Greenberg 400 RV 5.00 10/11 48 41 54.6 45.4 100.0%
49 OK 5 SurveyUSA 435 LV 4.70 10/10 33 62 36.0 64.0 0.0%
50 PA 6 RT Strategies 1023 LV 3.07 10/10 52 46 53.2 46.8 100.0%
51 PA 7 RT Strategies 1017 LV 3.08 10/10 52 44 54.4 45.6 100.0%
52 PA 8 Grove Insight 400 RV 4.90 10/15 44 40 53.6 46.4 99.8%
53 PA 10 Bennett,Petts 400 RV 4.90 10/9 51 37 58.2 41.8 100.0%
54 VA 2 RT Strategies 982 LV 3.10 10/10 46 48 49.6 50.4 30.6%
55 VA 5 SurveyUSA 502 LV 4.40 10/10 40 56 42.4 57.6 0.0%
56 VA 10 RT Strategies 1004 LV 3.07 10/10 42 47 48.6 51.4 3.7%
57 WA 8 RT Strategies 1015 LV 3.09 10/10 45 48 49.2 50.8 15.5%
58 WI 8 RT Strategies 983 LV 3.09 10/10 48 46 51.6 48.4 97.9%
_________________________________________________________
GENERIC CONGRESSIONAL POLLS
The strong Democratic trend in the House continues. They currently lead the GOP by 53.5-37.0% in the 3-poll Moving Average, a 7% increase in the last
month. The long-term Democratic trend has been increasing at the same rate as the decrease in Other (undecided) voters, while the GOP has been flat at
38%.
If the long-term linear trend continues, the Dems will win the Generic vote in a 61-39 LANDSLIDE.
http://www.geocities.com...Trend_11372_image001.png
http://www.geocities.com...Trend_15084_image001.png
Table headings:
Dem: Democratic poll%
Rep: Republican poll%
Diff: Dem - Rep
Dem3: Democratic 3-poll moving average
Rep3: Republican 3-poll moving average
Diff3:Dem3 - Rep3
Poll Survey Dates REP DEM Other Diff Rep3 Dem3 Diff3
Number Average All 38.2 49.1 12.7 10.8 38.3 49.1 10.8
2005
1 Newsweek RV. 905 38 50 12 12 39.0 51.0 12.0
2 Pew RV...... 911 40 52 8 12 39.8 50.0 10.3
3 DemCorp LV.. 921 39 48 13 9 40.5 49.0 8.5
4 Newsweek RV. 930 42 47 11 5 40.8 47.0 6.3
5 DemCorp LV.. 1010 41 46 14 5 41.3 46.7 5.3
6 GWU LV...... 1012 41 47 13 6 37.7 44.3 6.7
7 Hotline RV.. 1016 31 40 29 9 37.0 45.0 8.0
8 DemCorp LV.. 1023 39 48 12 9 37.7 46.0 8.3
9 Gallup RV... 1023 43 50 7 7 39.7 50.0 10.3
10 ABC/WP RV... 1102 37 52 12 15 40.0 50.0 10.0
11 DemCorp LV.. 1106 40 48 12 8 37.7 51.0 13.3
12 Newsweek RV. 1105 36 53 11 17 37.0 47.3 10.3
13 Hotline RV.. 1115 35 41 24 6 37.3 47.3 10.0
14 DemCorp LV.. 1120 41 48 11 7 37.3 45.7 8.3
15 Time RV.... 1201 36 48 15 12 38.7 48.3 9.7
16 DemCorp LV.. 1204 39 49 12 10 36.0 46.3 10.3
17 CBS/NYT RV. 1206 33 42 25 9 37.7 46.7 9.0
18 DemCorp LV.. 1212 41 49 9 8 35.7 44.7 9.0
19 Hotline RV...1213 33 43 25 10 37.0 45.7 8.7
20 NPR LV...... 1218 37 45 17 8 37.0 46.3 9.3
21 ABC/WP RV... 1218 41 51 9 10 40.3 48.3 8.0
2006
22 Gallup RV... 108 43 49 8 6 39.3 47.7 8.3
23 CBS/NYT RV. 125 34 43 23 9 39.3 47.0 7.7
24 DemCorp LV.. 125 41 49 10 8 37.7 48.7 11.0
25 ABC/WP RV... 126 38 54 9 16 40.0 51.0 11.0
26 Pew RV...... 205 41 50 9 9 40.7 51.3 10.7
27 Gallup RV... 212 43 50 8 7 41.7 48.7 7.0
28 GWU LV...... 215 41 46 14 5 38.3 47.3 9.0
29 Hotline RV.. 219 31 46 23 15 37.3 46.7 9.3
30 DemCorp LV.. 227 40 48 12 8 36.7 49.0 12.3
31 Gallup RV... 301 39 53 7 14 37.7 49.7 12.0
32 FOX LV..... 301 34 48 18 14 37.3 52.0 14.7
33 Gallup RV... 312 39 55 7 16 36.7 51.7 15.0
34 NPR LV......314 37 52 11 15 38.3 52.3 14.0
35 Newsweek RV. 317 39 50 11 11 39.0 50.7 11.7
36 Time RV.... 323 41 50 9 9 38.0 48.0 10.0
37 CBS RV.... 409 34 44 22 10 38.3 49.7 11.3
38 ABC/WP RV... 409 40 55 5 15 38.7 50.3 11.7
39 Gallup RV... 409 42 52 6 10 41.0 52.7 11.7
40 Pew RV...... 416 41 51 8 10 41.0 51.0 10.0
41 CNN RV ..... 423 40 50 9 10 37.7 48.3 10.7
42 Cook...... 430 32 44 24 12 37.0 49.3 12.3
43 Gallup RV... 430 39 54 7 15 36.3 46.3 10.0
44 FOX LV..... 503 38 41 21 3 38.3 49.0 10.7
45 CNN RV ..... 507 38 52 10 14 36.3 45.7 9.3
46 CBS/NYT RV. 508 33 44 23 11 36.7 48.7 12.0
47 Newsweek RV. 512 39 50 11 11 37.3 48.7 11.3
48 ABC/WP RV... 515 40 52 9 12 38.3 47.0 8.7
49 Fabrizio LV. 517 36 39 25 3 37.3 44.3 7.0
50 Hotline RV.. 521 36 42 22 6 38.0 44.0 6.0
51 Gallup RV... 604 42 51 7 9 39.0 48.0 9.0
52 Gallup RV... 611 39 51 10 12 38.0 49.3 11.3
53 FOX LV..... 614 33 46 20 13 36.7 47.3 10.7
54 CNN RV ..... 615 38 45 16 7 36.7 47.3 10.7
55 Pew RV...... 619 39 51 10 12 37.7 45.7 8.0
56 Hotline RV.. 625 36 41 24 5 38.0 48.0 10.0
57 ABC/WP RV... 625 39 52 9 13 37.7 49.0 11.3
58 Gallup RV... 625 38 54 7 16 37.3 51.0 13.7
59 TIME LV.... 629 35 47 18 12 38.0 50.7 12.7
60 Gallup RV... 709 41 51 9 10 38.7 49.7 11.0
61 AP-Ipsos RV. 712 40 51 9 11 38.3 48.0 9.7
62 FOX LV..... 712 34 42 25 8 35.3 47.0 11.7
63 Hotline RV.. 723 32 48 20 16 33.7 45.0 11.3
64 CBS/NYT RV. 725 35 45 20 10 35.7 48.0 12.3
65 Gallup RV... 770 40 51 8 11 38.3 49.7 11.3
66 CNN RV ..... 803 40 53 7 13 39.7 52.0 12.3
67 ABC/WP RV... 806 39 52 8 13 38.7 53.3 14.7
68 AP-Ipsos RV. 809 37 55 8 18 35.3 51.7 16.3
69 FOX LV..... 809 30 48 22 18 36.0 51.0 15.0
70 Gallup RV... 810 41 50 9 9 36.7 49.7 13.0
71 Newsweek RV. 811 39 51 10 12 40.3 50.3 10.0
72 Pew RV...... 813 41 50 9 9 37.7 47.0 9.3
73 Hotline RV.. 820 33 40 27 7 39.7 45.7 6.0
74 Gallup RV... 820 45 47 7 2 40.3 46.3 6.0
75 CNN RV ..... 820 43 52 6 9 40.0 48.7 8.7
76 CBS/NYT RV. 821 32 47 21 15 38.3 50.0 11.7
77 TIME LV.... 824 40 51 9 11 36.7 49.3 12.7
78 Newsweek RV. 825 38 50 12 12 36.7 49.7 13.0
79 FOX LV..... 830 32 48 21 16 37.7 50.3 12.7
80 CNN LV ..... 902 43 53 4 10 39.0 50.3 11.3
81 ABC RV .....907 42 50 9 8 41.3 51.0 9.7
82 Pew RV...... 910 39 50 11 11 40.7 51.0 10.3
83 Gallup RV... 910 41 53 7 12 39.3 48.0 8.7
84 FOX LV..... 913 38 41 21 3 42.3 47.3 5.0
85 Gallup LV... 917 48 48 4 0 40.3 46.3 6.0
86 CBS/NYT RV. 919 35 50 15 15 41.7 51.0 9.3
87 CNN LV ..... 924 42 55 3 13 38.3 51.3 13.0
88 FOX LV..... 927 38 49 14 11 37.7 49.0 11.3
89 Hotline RV.. 927 33 43 24 10 34.7 44.7 10.0
90 Zogby LV.. 928 33 42 25 9 36.0 46.0 10.0
91 CNN LV ..... 1002 42 53 5 11 37.7 49.3 11.6
92 AP-Ipsos RV. 1004 38 51 11 13 40.3 52.3 11.9
93 Pew RV...... 1004 41 51 8 10 39.3 51.8 12.4
94 TIME LV.... 1005 39 54 7 15 39.7 52.5 12.8
95 Newsweek RV. 1006 39 51 7 12 39.7 54.3 14.6
96 ABC RV......1008 41 54 5 13 39.0 55.5 16.5
97 CNN LV ..... 1008 37 58 5 21 38.0 55.0 17.0
98 Gallup LV... 1008 36 59 4 23 36.3 54.0 17.7
99 Harris LV... 1009 36 49 15 13 37.7 53.5 15.8
100 FOX LV..... 1011 41 50 9 9 39.0 51.8 12.8
101 CNN LV......1015 40 56 4 16 39.3 53.3 13.9
102 NBC RV......1016 37 52 11 15 38.0 54.3 16.3
103 Newsweek LV. 1021 37 55 8 18 37.0 53.5 16.5


 Vets Push Back at Trump, Musk Plan to Slash Health Care, 80K V.A. Jobs: 'BradCast' 3/27/25
 'Green News Report' 3/27/25
 Signal Scandal Worsens for Trump, GOP; Big Election Victories for Dems in PA: 'BradCast' 3/26/25
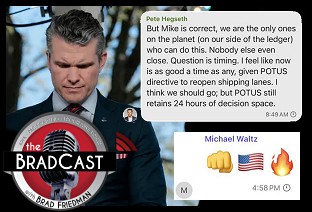 'Emptywheel' on Why Trump NatSec Team Should 'Resign in Disgrace' After Signal Chat Debacle: 'BradCast' 3/25/25
 'Green News Report' 3/25/25
 Postal Workers Union Prez: USPS 'Belongs to the People, Not the Billionaires':
 Sunday 'Suddenly Conceivable' Toons
 We're ALL Voice of America Now: 'BradCast' 3/20/25
 'Green News Report' 3/20/25
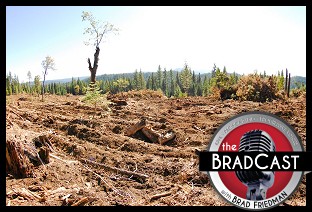 What Trump's 'Timber Production Expansion' Means (and Costs): 'BradCast' 3/19/25
 Courts Largely Holding Against Trump, Musk Lawlessness: 'BradCast' 3/18/25
 'Green News Report' 3/18/25
 Chief VOA Reporter on Outlet Falling Silent First Time Since 1942: 'BradCast' 3/17/25
 Sunday 'The Usual' Toons
 'Green News Report' 3/13/25
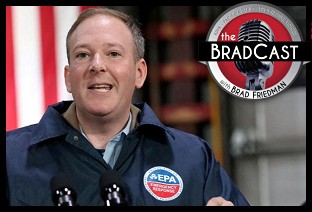 Trump EPA Unveils Plans to Endanger, Sicken Americans: 'BradCast' 3/13/25
 Trump Nixed Enforce-ment Against 100 Corp. Lawbreakers: 'BradCast' 3/12/25
 Bad Day for 'Strongmen': 'BradCast' 3/11
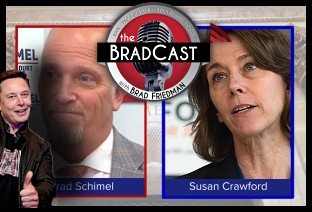 WI Election Could Flip Supreme Court Control, Musk Jumps In: 'BradCast' 3/10
 'What Else Could a Russian Asset Do That Trump Hasn't?': 'BradCast' 3/6/25
 The Longest, Dullest, Most Lie-Filled 'SOTU' Ever: 'BradCast' 3/5/25
 Trump Bad for Biz... and Farmers... and Nat'l Parks... and...: 'BradCast' 3/4/25
 Trump Targeting 50% Cuts, Office Closures at Social Security: 'BradCast' 3/3/25
 VA GOP VOTER REG FRAUDSTER OFF HOOK
 Criminal GOP Voter Registration Fraud Probe Expanding in VA
 DOJ PROBE SOUGHT AFTER VA ARREST
 Arrest in VA: GOP Voter Reg Scandal Widens
 ALL TOGETHER: ROVE, SPROUL, KOCHS, RNC
 LATimes: RNC's 'Fired' Sproul Working for Repubs in 'as Many as 30 States'
 'Fired' Sproul Group 'Cloned', Still Working for Republicans in At Least 10 States
 FINALLY: FOX ON GOP REG FRAUD SCANDAL
 COLORADO FOLLOWS FLORIDA WITH GOP CRIMINAL INVESTIGATION
 CRIMINAL PROBE LAUNCHED INTO GOP VOTER REGISTRATION FRAUD SCANDAL IN FL
 Brad Breaks PA Photo ID & GOP Registration Fraud Scandal News on Hartmann TV
  CAUGHT ON TAPE: COORDINATED NATIONWIDE GOP VOTER REG SCAM
 CRIMINAL ELECTION FRAUD COMPLAINT FILED AGAINST GOP 'FRAUD' FIRM
 RICK SCOTT GETS ROLLED IN GOP REGISTRATION FRAUD SCANDAL
 VIDEO: Brad Breaks GOP Reg Fraud Scandal on Hartmann TV
 RNC FIRES NATIONAL VOTER REGISTRATION FIRM FOR FRAUD
 EXCLUSIVE: Intvw w/ FL Official Who First Discovered GOP Reg Fraud
 GOP REGISTRATION FRAUD FOUND IN FL


